Volv Global Blog

Posts about:

Patient Finding (2)

One of Nightingale’s most significant innovations was a diagram which showed the causes of soldiers’ deaths over two successive years in the Crimea

Contextualising Clinical Challenges: The History of Medical Knowledge

When Florence Nightingale returned from the Crimea to London in 1856, she set about publicising her statistical findings as well as her proposed medical reforms. But she was aware of the limited effect one person could have on practices within the armed forces and the nursing profession.

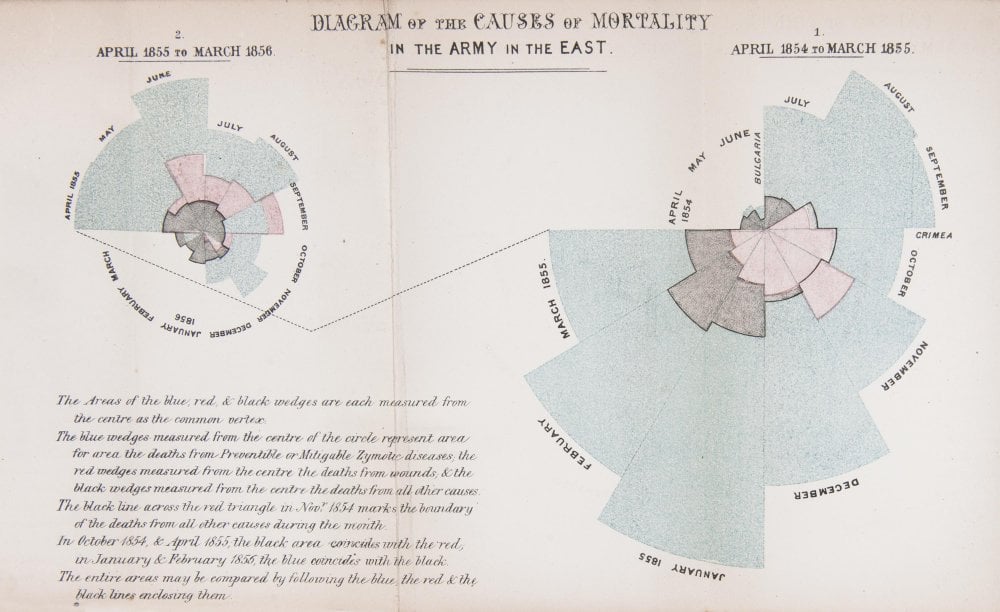
The first year (shown on the right of the diagram) was 1854–5, following her arrival in the region. The second (on the left) was 1855–6, after she had implemented a series of reforms to the hospital and nursing practices.

In her diagram, each wedge represented a month, and the area of the wedge showed the number of soldiers who had died that month. The blue area showed deaths from preventable diseases picked up in the terrible conditions at the Crimea. Red sections showed deaths from battlefield wounds. Black areas were deaths from other causes.

Readers could see two things. The first was that the reforms Nightingale implemented and campaigned for had made a huge positive difference to mortality. The second, and more shocking result, was that more soldiers died from preventable diseases during the war than from injuries.

Today, we are used to seeing statistics presented in graphical form. Infographics are common in newspapers, magazines and online. However, in 1850s Britain, the approach was revolutionary.

Credit: Thanks to the Science Museum, London for the inspiring image above and content. 

Download PDF

Read More
Improving the Rare Disease Diagnostic Journey with using AI. Using Volv's methodology inTrigue and Scailyte's single-cell data analysis platform ScaiVision

Improving the Rare Disease Diagnostic Journey with Advanced AI

The journey from first symptoms to diagnosis is a long one for most patients with rare diseases. According to a survey from EURODIS, 25 per cent of patients with among the most common rare diseases waited between 5 and 30 years for a diagnosis and 40 per cent were misdiagnosed during that time.

There are many reasons why diagnosis is so challenging. One is that most physicians have limited knowledge about rare or ultra-rare diseases. Another is that as many as 60% of rare diseases present with significant heterogeneity of symptoms, making it extremely difficult to diagnose patients early enough in their disease progression.

A third barrier to diagnosis can often be attributed to the complexity of the diagnostic test currently available. For some rare conditions, deep muscle biopsies are still used for diagnosis and for some rare heart conditions, stents are often the only commercial diagnostic tool available to accurately identify a condition.

Read More
Determining patient prevalence with rare and ultra-rare diseases will help to build your gene therapy value story

Building Your Gene Therapy Value Story From Day One

Cell and gene therapies, also known as advanced therapy medicinal products (ATMPs), are potentially life changing. For patients with rare diseases, they extend the hope of a longer, healthier life and even of a cure. But these therapies are exceptionally expensive with up-front costs ranging from $500,000 to $2 million. Additionally, some incur heavy ongoing costs throughout the life of the patient.

For health technology assessment (HTA) organisations – which must balance clinical effectiveness, safety and efficacy with cost effectiveness, social outcomes and ethical considerations – the decision to support market access for ATMPs is a complex one. Budget constraints mean HTAs and insurers often must make tough decisions balancing the ATMP reimbursement with a reduction in spending elsewhere in the healthcare system. Consequently, therapies that are not viewed as compelling, face rejection. Moreover, the decision-making process can vary from region to region: vastly different decision criteria, for example, are adopted in the UK, the USA and China.

Read More
Why can’t we find the 50% of people with rare diseases who remain undiagnosed?

Why can’t we find the 50% of people with rare diseases?

It might be said that picking out patterns to identify patients with rare diseases is a bit like distinguishing thousands of constellations of stars. Neither is within the scope of the human eye and both require extremely advanced technologies to even begin to decipher and separate patterns. Yet finding the 50 percent of undiagnosed patients with one of the approximately 7,000 rare diseases is a medical and clinical imperative.

Typically, the way clinicians diagnose patients is by taking what the broader healthcare industry knows about a disease – generally as described by key opinion leaders (KOL) – and correlating a patient’s symptoms to those definitions. The problem with this approach when it comes to rare and ultra-rare diseases is that it is subject to experiential bias. If the KOL has not observed a pattern of symptoms or the order in which those symptoms emerge differs significantly, the patient will likely remain undiagnosed.

There is so much we don’t know about rare disease, but what we do know is that there is enormous heterogeneity of symptoms – so much so that as many as 60% of rare diseases present with significant heterogeneity, according to genomics experts. Understanding this 60% variation in symptoms with rare diseases is undoubtedly the greatest challenge facing both healthcare professionals as well as the companies seeking to find and develop new treatment options. Even for those rare diseases where there are already treatments, the difficulty can be diagnosing patients early enough to limit the worst effects of the disease. For example, some symptoms may not be flagged as significant from a clinical perspective, despite the challenges they present to the patient on their journey to diagnosis, and by the time the patient’s symptoms escalate to correlate with recognised patterns, it’s often much later in the disease’s progression, on average, six years from the onset of symptoms.

Read More